The beginning
Since January 2024 I have been studying the book of FrederickS. Hillier “Introduction to Operations Research”, mainly because i have been looking into more trend knowledge about data models, so i can analyse in new ways and for me this book has everything of what i was looking for.
The exercise i have been practicing is the optimization of the resources that a factory has in every floor, so we can find the best combination of numbers that can give the company more profit.
| Floor | Product1 | Product2 | Available production time per week in hours |
| 1 | 1 | 0 | 4 |
| 2 | 0 | 2 | 12 |
| 3 | 3 | 2 | 18 |
| Revenue | 3000 | 5000 |
| Restrictions | Linear expressions |
| For floor 1 | X1<4 |
| For floor 2 | 2×2<12 |
| For floor 3 | 3×1+2×2<18 |
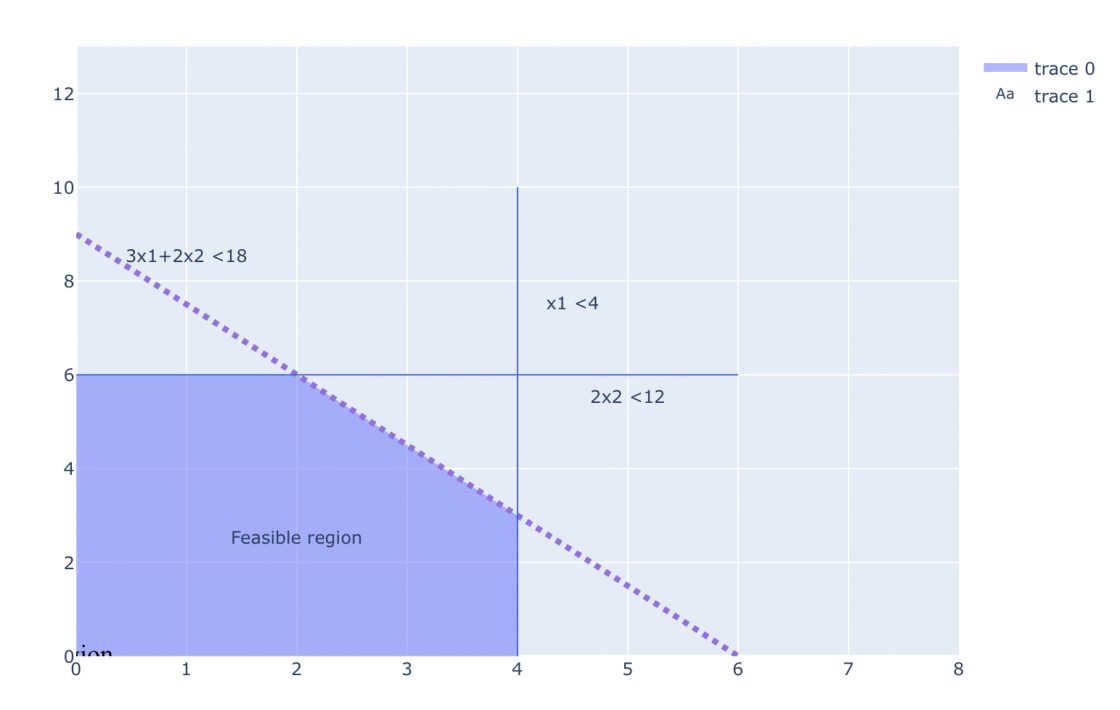
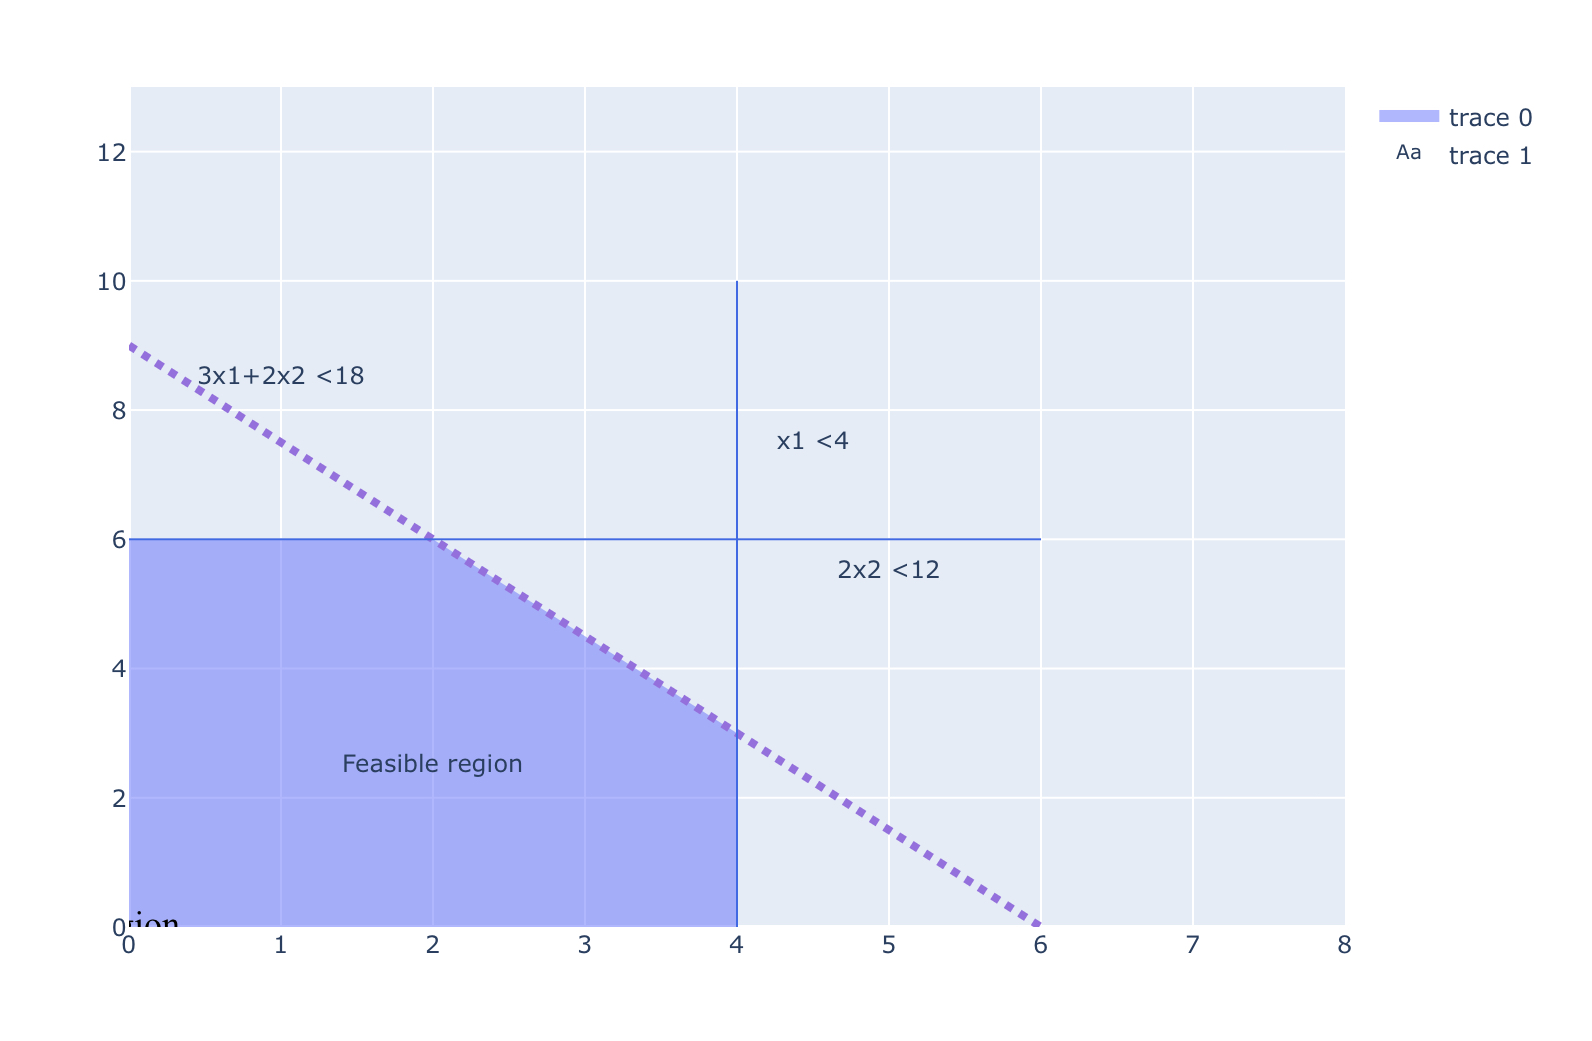
If we reduce the equations we will see this type of graph that tells us what can be the feasible region.
Reducing the formulas to x1>4, x2<6 and 3×1+2×2<18 to 3(0)+2×2=18 that makes x1=9 and 3×1+2(0)=18 to x2=6
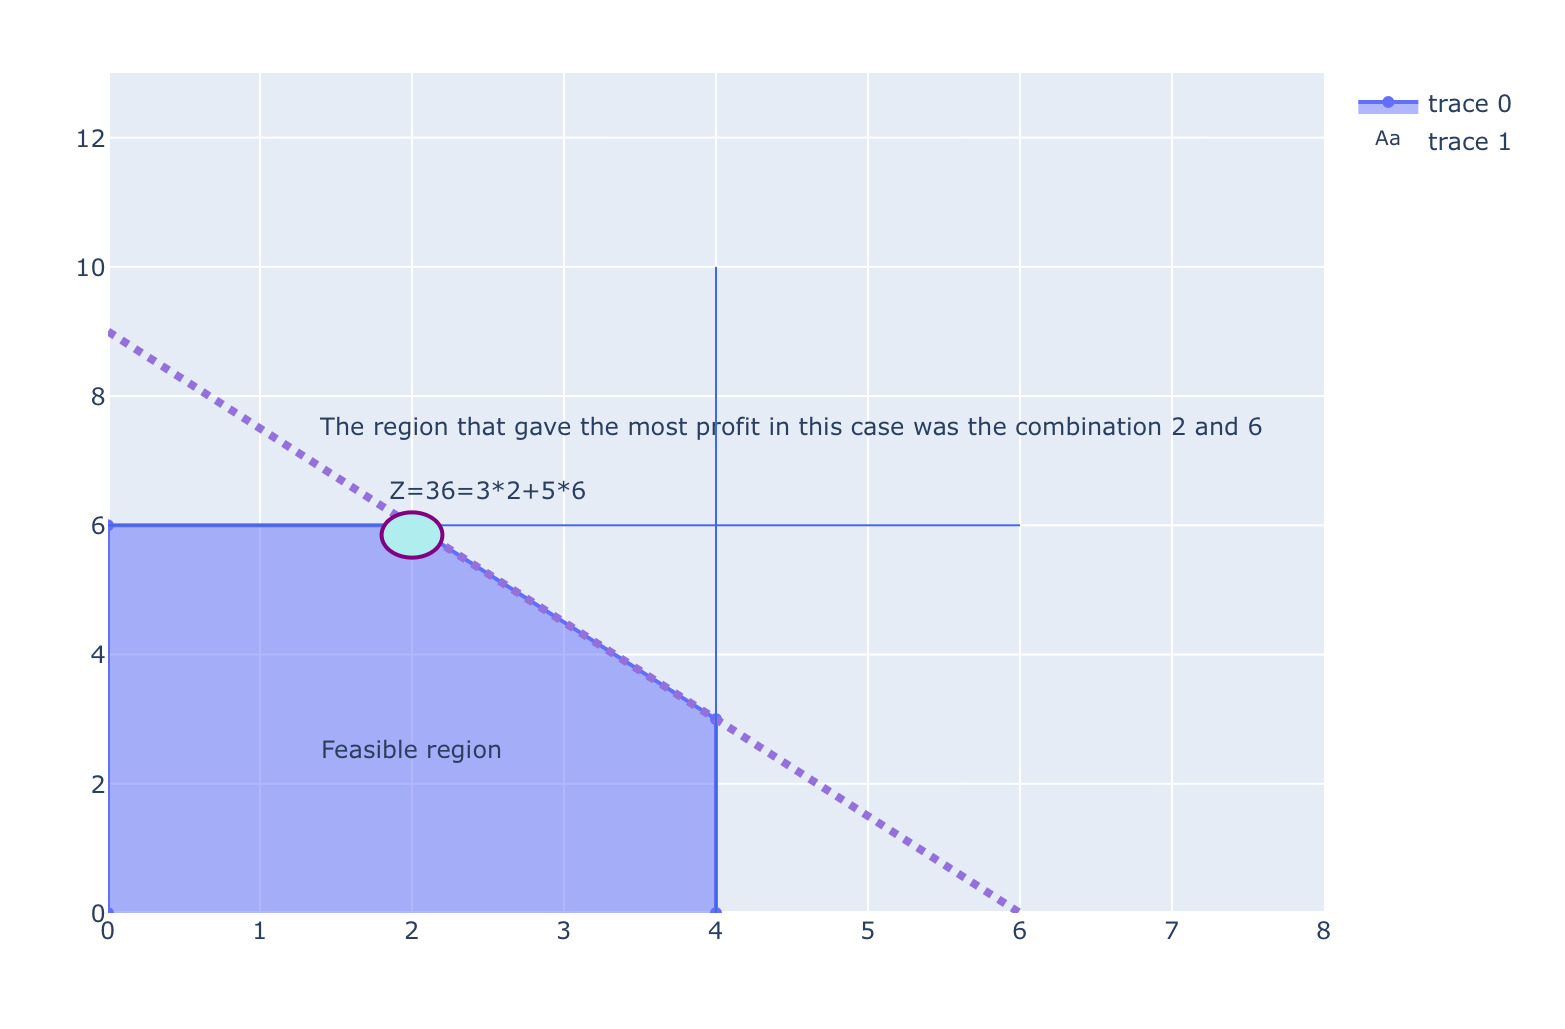
The result
Then when we have this we can try different combinations from the feasible region until we have the best one, in this case the best one was 2 and 6, so we can have 36000 of revenue
| X1 | x2 | Z Revenue |
| 0 | 0 | 0 |
| 0 | 6 | 30 |
| 2 | 6 | 36 |
| 4 | 3 | 27 |
| 4 | 0 | 12 |
Only with this we can have a simple but very good explanation of this type of data models, in this case to optimaze the resources per floor in a company, like the WYNDOR GLASS CO. Factory.
I will publish a dashboard soon so i can explain this in live.