The data source
John Snow Labs is an award-winning AI company that helps healthcare and life science organizations put AI to work faster, they have open-source data sets related to medicine.
This is the pdf of the case : https://drive.google.com/file/d/1LIJ2Ziwr_srMZvkM1Cd7rZstCLK0JdDM/view?usp=sharing
The case study
The case wants to solve these problems:
1.The information is to be used to monitor and plan assistance in winter times.
2.Identify the times of the year when activity increases
3.Provide information to improve patient care and suggest improvements to Scottish Health Government policy.
The data to work
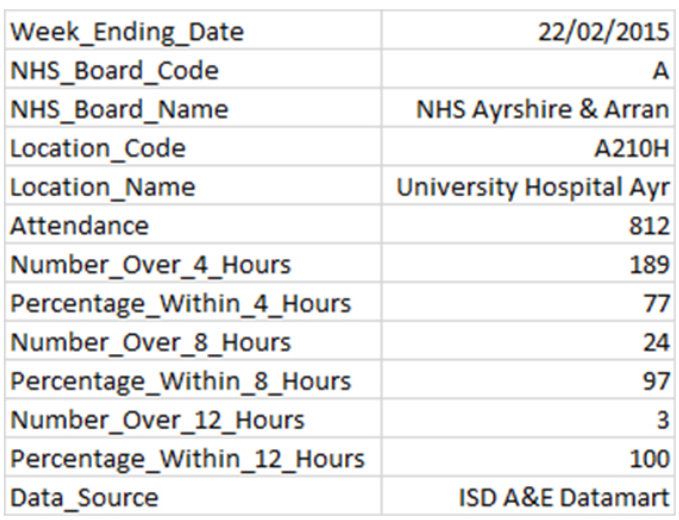
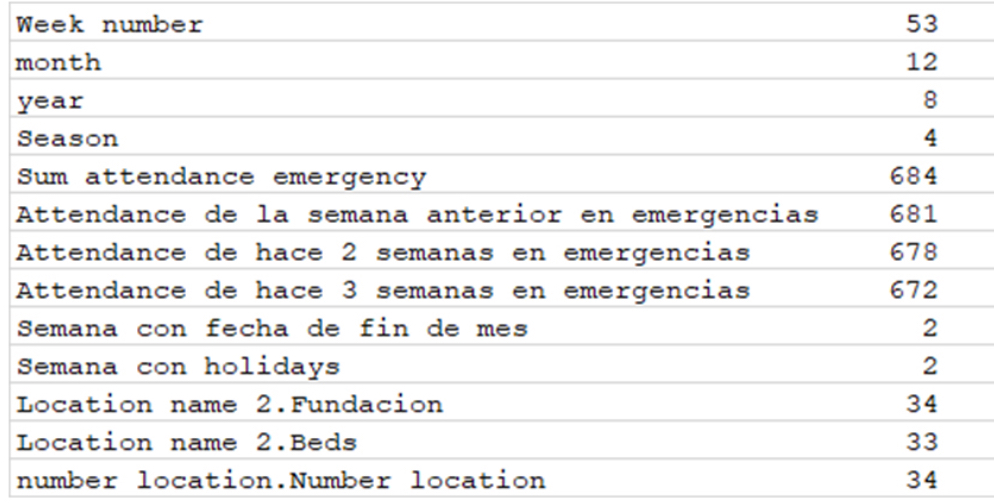
The first image is the raw columns of the data set, after cleaning and an investigation process we are left with the second set.
-First set
-Second set
Here is a look at statistical graphs by Long time ranges
Summary of distributions by year and seasons (long time ranges)
Feature engineering
Correlation

Graphs about the model
Test labels vs predictions
Axis x are the count of the labels 1557 of the test data frame (sum of attendance), Axis y are the sum of attendance, the max value we have is 10264 in the covid period.
Test labels in blue. predictions in green, as we can see our model has a lot of potential, the lines almost fit perfectly.
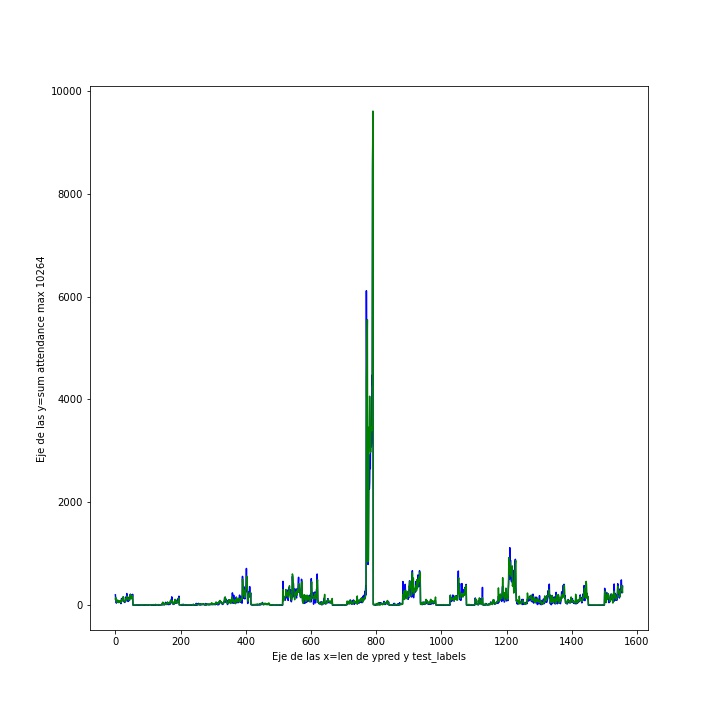
Test labels vs predictions
Axis y and x are the sum of attendance, the max value we have is 10264 in the covid period, the scatter points are the predictions, this tells as how linear can be our model, but as we see is not, so a neural net was a got option for this case.
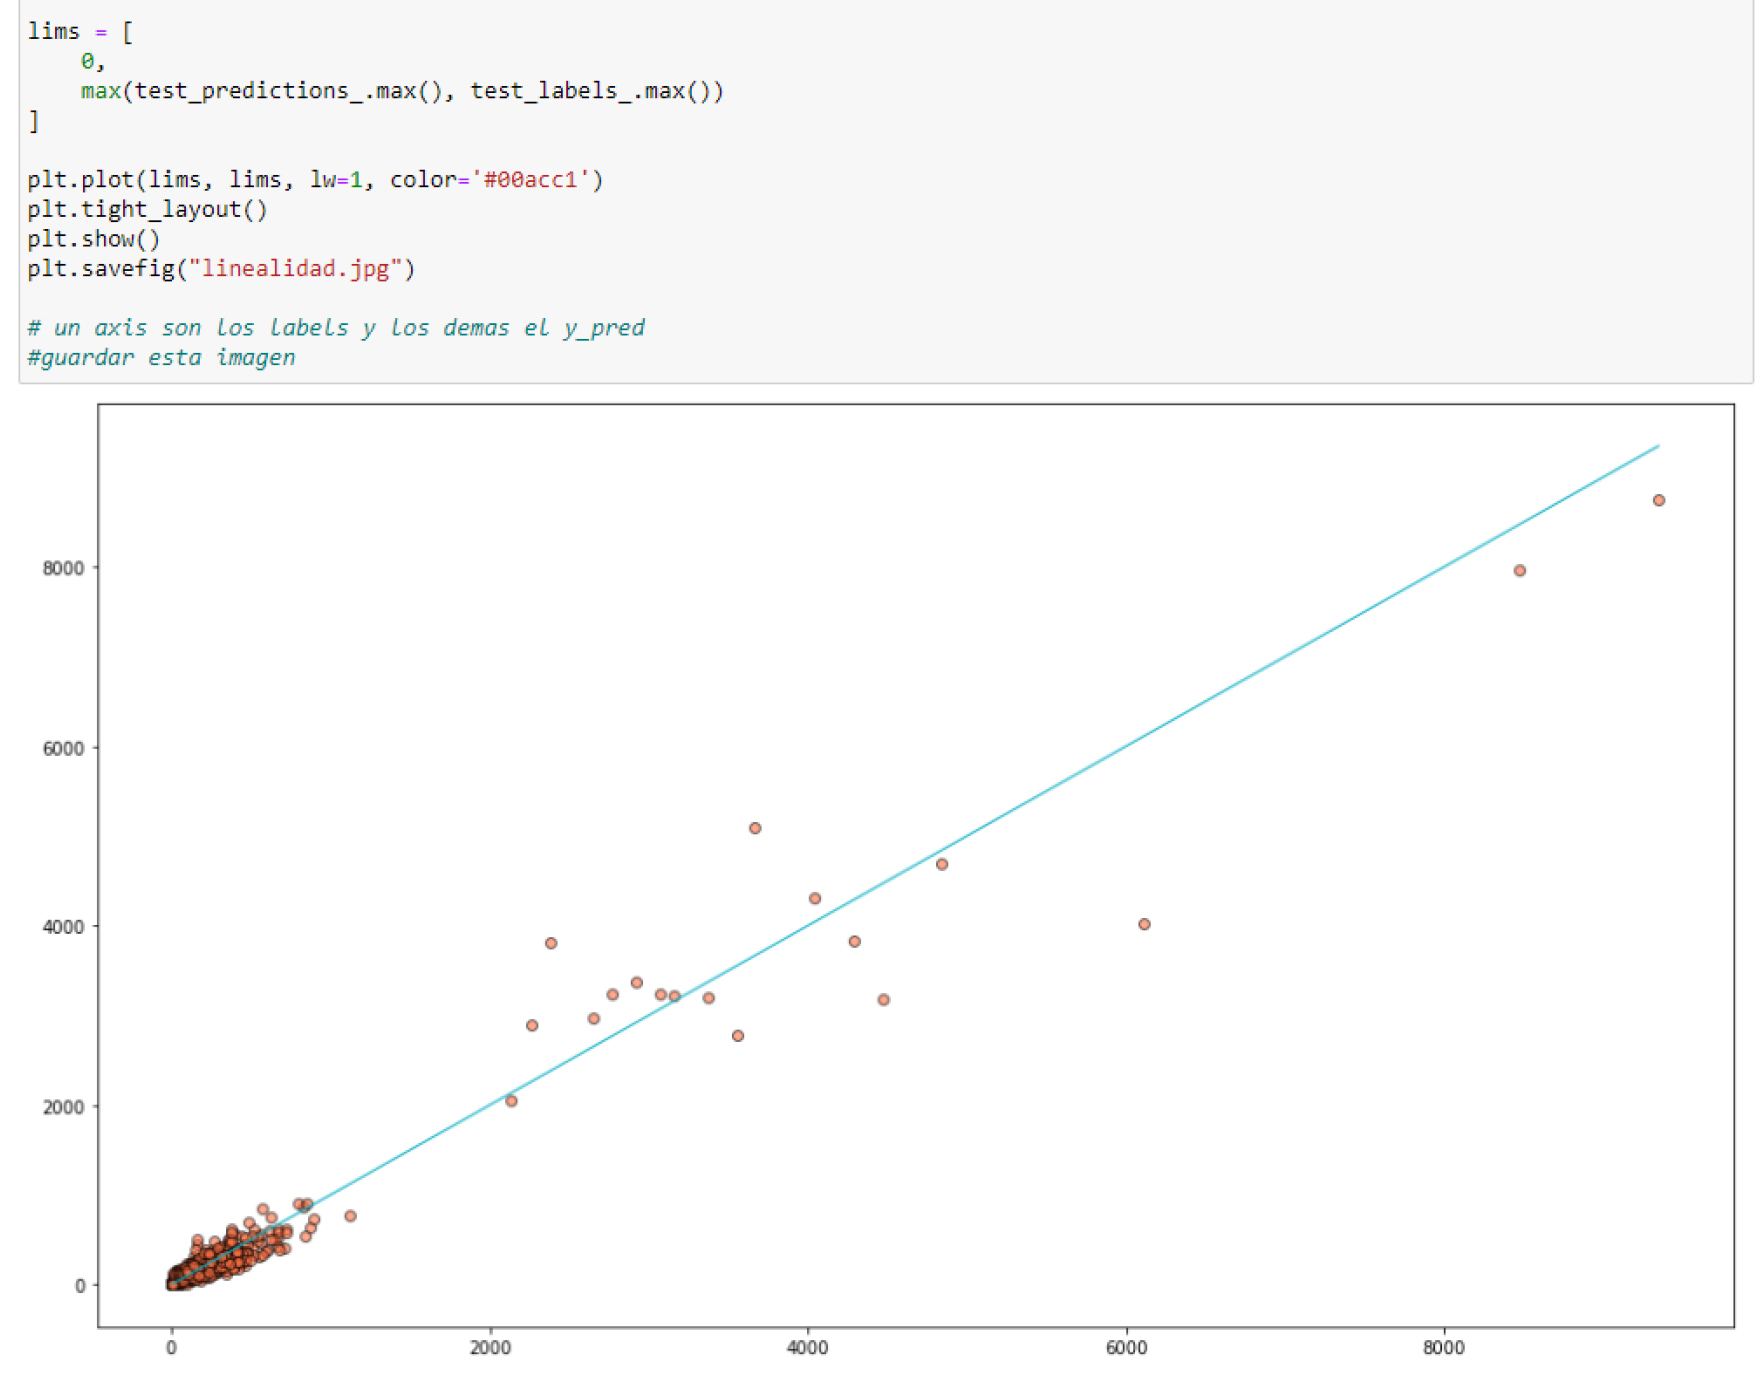
The idea is to keep fitting the parameters to guess how is the ideal model to decrease the error of prediction.
Training
As we see in the training process the loss function performed well meanwhile it was training, the two lines, are similar and don´t have any increase.

How do we know we are in the right path?
Our model has a
r2_score: 0.954763836772263
MAE = 39.34
Precision = 72.49154310960036
Error = 27.50845689039964
Some arrays to try the model
Raigmore Hospital
The label is 101, and the prediction 93, so a 8 of difference of 8%, a very small error

Aberdeen Royal Infirmary
The label es 113, and the prediction 83, so is a 30 of difference of 26.5%, this means that we have to increase the number of neurones or maybe layers to fix more the error

However, there are attendance patterns that do not predict very well, those with attendances less than 10.
Perhaps since we have hospitals with a small capacity of 0 – 20 and others with 30 – 500 and others with 30 to 1300, I believe it means that we need more layers of learning, because it seems that we have different types of populations.
My idea would be to add more layers and try more epochs to improve the model, until you learn the capacity by hospital types
Please find my predictions lab on Streamlit here
https://enaguerra-predictions-hospitals-app-tujgf9.streamlit.app/
