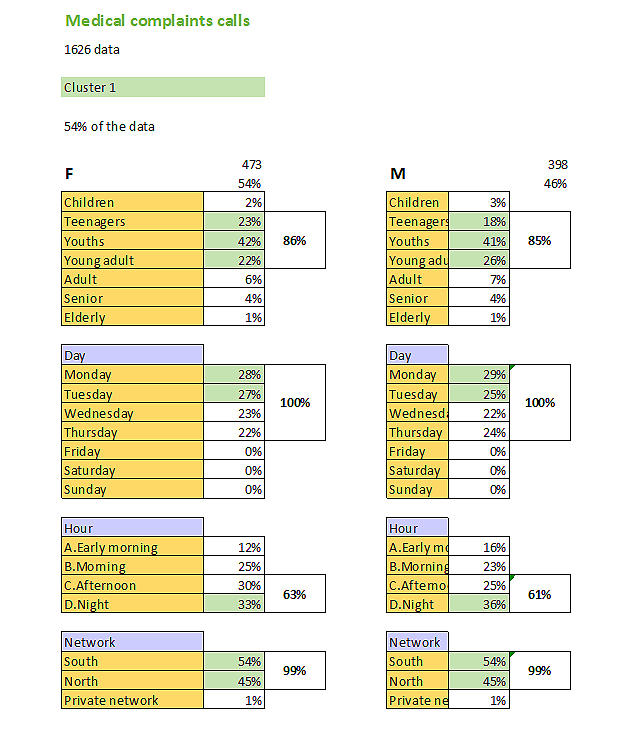
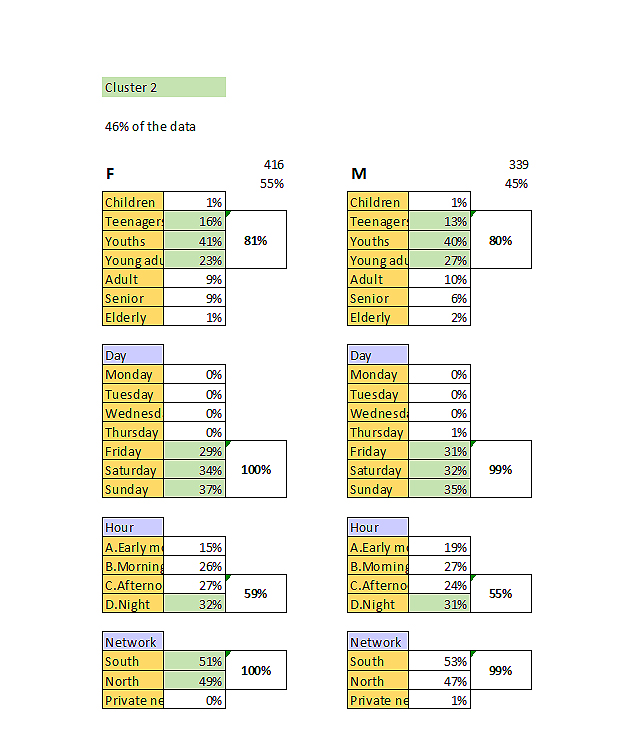
I have a Kaggle data set of calls and we have been asked to cluster the people who call the call center into two profiles, about medical complaints.
The high management of the company has asked to create workshops to update operators with more personalized content to answer calls
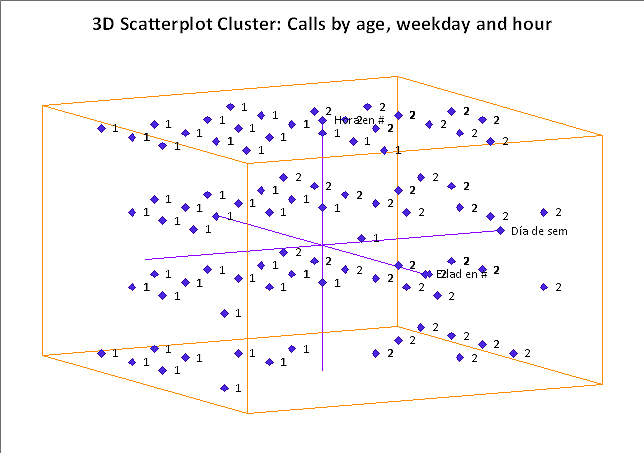
I have selected the variables Age, day of the week, hour time and gender.
In the 3d scatterplot below we can see that the cluster has divided the profiles mostly into weekdays (Monday, Tuesday, Wednesday and Thursday) and weekends (Friday, Saturday and Sunday)
Data Cluster analysis
Please find the Kaggle data set in the link below.